

Crypto Fear and Greed Index: How the CoinMarketCap Index Works
The crypto Fear and Greed Index sums up market mood in one number from 0 to 100: near zero means panic, near 100 means euphoria. CoinMarketCap runs its own version, built from five groups of data and covering the wider market rather than Bitcoin alone. Here is how it is put together and how I actually use it.
Contents
- What is the Fear and Greed Index in crypto
- How the CoinMarketCap Fear and Greed Index is calculated
- Fear and Greed Index meaning: what each zone tells you
- CoinMarketCap vs Alternative.me Fear and Greed Index
- How to use the Fear and Greed Index in crypto
- When to buy: why the index is not a buy or sell button
What is the Fear and Greed Index in crypto
The idea comes from stocks: CNN has long published a Fear and Greed Index for the US equity market. The logic is simple – crowds buy on greed and sell on fear, so extreme readings often line up with local turning points in price.
CoinMarketCap launched its CMC Crypto Fear and Greed Index in August 2023. Unlike many similar gauges, it doesn't stop at Bitcoin: it draws on the largest coins, the options market, stablecoins and the behaviour of CMC's own users.
How to check the Fear and Greed Index today
The live reading is at coinmarketcap.com/charts/fear-and-greed-index/, with an all-time chart plotted against Bitcoin price and volume, plus values for yesterday, last week and last month. A compact version of the gauge also sits in the header of the CMC home page. If you want the history as data, the CMC API serves it for free.
How the CoinMarketCap Fear and Greed Index is calculated
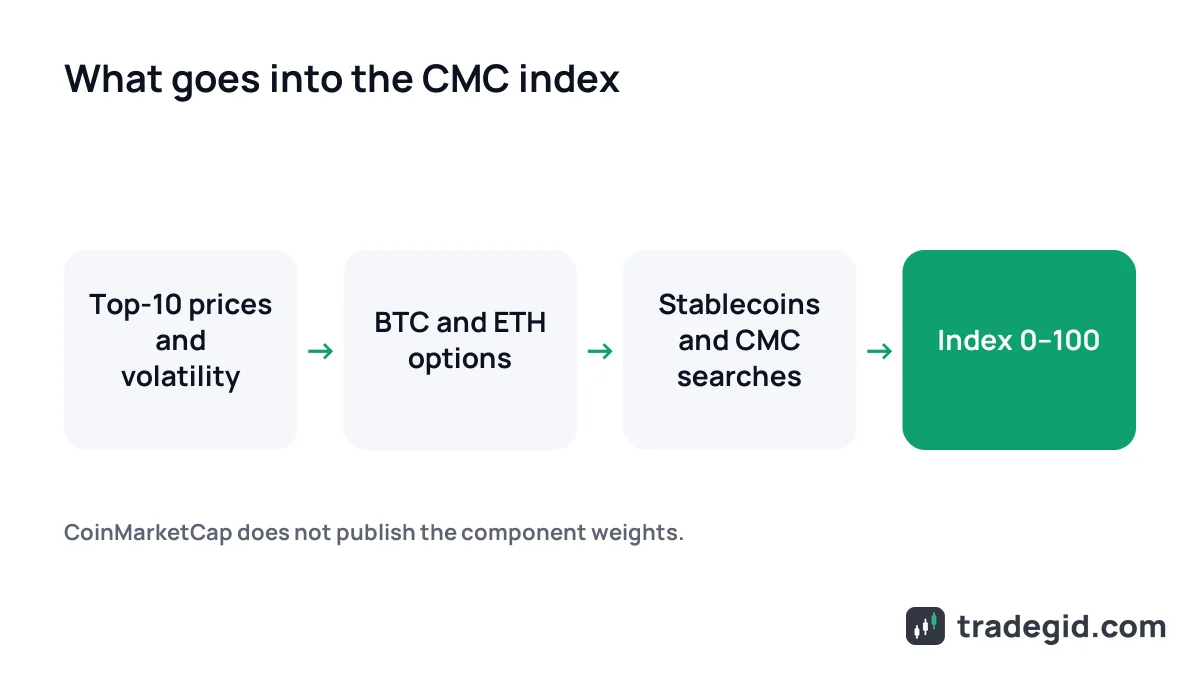
CMC discloses the components but not their weights – the methodology only mentions "a complex weighting system". There are five inputs:
- Price momentum – performance of the top 10 cryptocurrencies by market cap, stablecoins excluded.
- Volatility – Volmex implied volatility indices for BTC and ETH (BVIV and EVIV), the market's expectation for the next 30 days.
- Derivatives – the put/call ratio in BTC and ETH options. More puts means more fear.
- Market composition – the Stablecoin Supply Ratio, Bitcoin's market cap relative to major stablecoins.
- CMC proprietary data – search trends and user engagement on the site.
The index blends price, expected volatility, options positioning and crowd behaviour, so it reacts both to moves and to the emotion around them.
Fear and Greed Index meaning: what each zone tells you
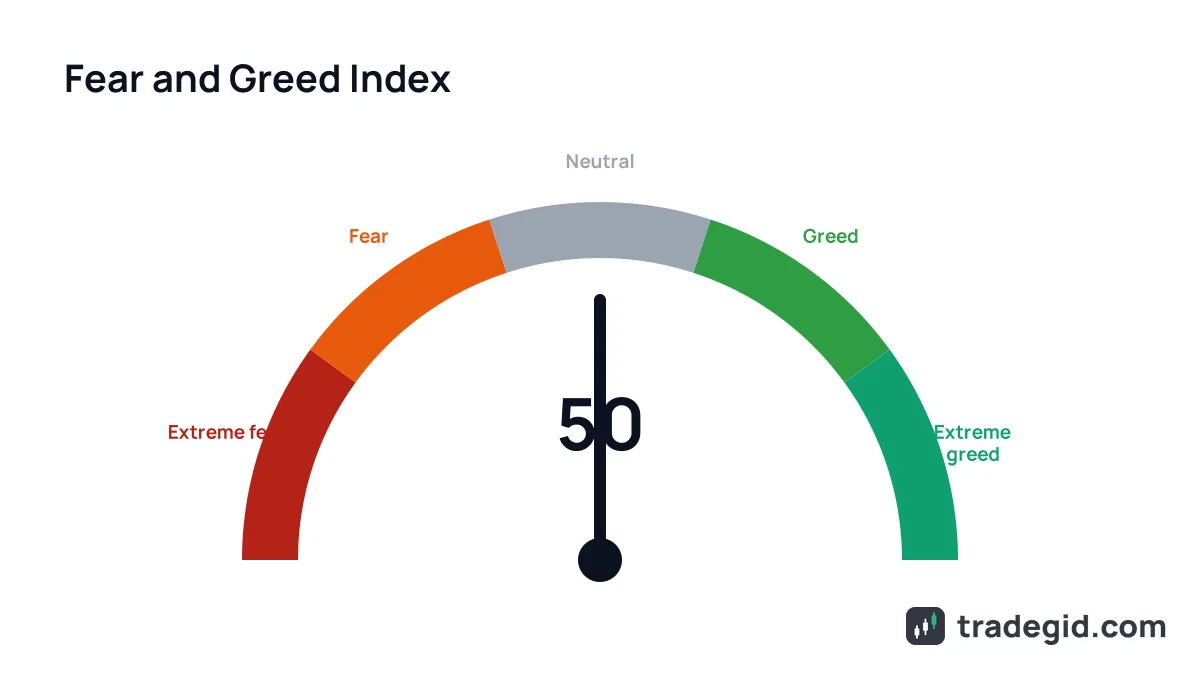
CoinMarketCap splits the scale into five equal zones of 20 points each. You can see this in the gauge configuration on the index page itself.
| Value | Zone | What the market usually looks like |
|---|---|---|
| 0–20 | Extreme fear | Sharp sell-off, long liquidations, "crypto is dead" on social media |
| 20–40 | Fear | Downtrend or drawn-out correction, buyers cautious |
| 40–60 | Neutral | Sideways market or no clear tilt |
| 60–80 | Greed | Rally, positive funding, new altcoins trending |
| 80–100 | Extreme greed | Euphoria, overheated leverage, high risk of a sharp pullback |
Zone boundaries from the gauge on coinmarketcap.com/charts/fear-and-greed-index/, as of October 2026. The market descriptions are my own observations, not part of the methodology.
On 26 October 2026 the CMC index read 43 – neutral. Alternative.me showed 50 the same day, also neutral, even though a month earlier their index sat at 74 in greed. A good reminder of how fast sentiment shifts.
CoinMarketCap vs Alternative.me Fear and Greed Index
The best-known crypto Fear and Greed Index is the one from Alternative.me, which shows up in exchange apps and news. The two indices rarely match, because they are built differently.
| Parameter | CoinMarketCap | Alternative.me |
|---|---|---|
| Coverage | Largest coins in the market | Bitcoin only |
| Price and volatility | Top 10 coins, Volmex BVIV and EVIV | BTC volatility and drawdowns, 25% |
| Volume and momentum | Momentum of the top 10 coins | BTC volume and momentum, 25% |
| Options | BTC and ETH put/call ratio | None |
| Social and search | Searches and engagement on CMC | Social media 15%, Google Trends 10% |
| Dominance and stablecoins | Stablecoin Supply Ratio | Bitcoin dominance, 10% |
| Surveys | None | 15%, paused as of October 2026 |
| Weights | Not disclosed | Disclosed |
| Value on 26 Oct 2026 | 43, neutral | 50, neutral |
Based on the methodology pages of coinmarketcap.com and alternative.me, as of October 2026.
In practice, Alternative.me reacts more sharply to Bitcoin, while CMC better reflects the broad backdrop, altcoins and options included. When both indices sit in the same extreme zone, the signal that the crowd is leaning too far one way is stronger.
Other data aggregators publish their own versions with their own formulas. Comparing "today's Fear and Greed" across sources makes little sense – follow one index over time.
Fear and Greed Index on TradingView and for stocks
Community scripts on TradingView try to rebuild a crypto fear and greed reading from price data, but each author uses their own formula, so treat them as separate indicators rather than the CMC index. The CNN index for the S&P 500 is a different tool built on stock-market data – it has no direct link to crypto, even though risk-off moods in stocks often spill into Bitcoin.
How to use the Fear and Greed Index in crypto
The contrarian approach
The classic Buffett line: "be fearful when others are greedy and greedy when others are fearful." CMC describes exactly this use in its FAQ. In extreme fear people sell at a loss, in extreme greed they buy the top, and the market often turns against the crowd.
The catch is that extreme zones can last for weeks. In a strong trend the index can stay in greed while price keeps climbing, and shorting "because it's greed" is a reliable way to get liquidated.
Confirmation for your own idea
I use the index as a filter, not a signal. Entry comes from the chart and levels first, then I check the backdrop. If I want to long an altcoin while the index is in extreme greed and funding across the market is high, I cut the position size or wait for a pullback.
- Find a setup on the chartLevel, trend, confirmation from indicators such as RSI or moving averages.
- Check the index and its directionThe trend matters as much as the number: climbing out of extreme fear says more than a flat reading of 25.
- Cross-check derivativesFunding and the long/short ratio show how heavily the market is leveraged to one side.
- Adjust position sizeAgainst an extreme zone – smaller size and more room for the stop; with the mood – normal size.
The index answers "how one-sided is the crowd", not "where will price go", so it should change your position size, not your trade direction.
When to buy: why the index is not a buy or sell button
Where it helps
- Shows overall market mood at a glance
- Keeps you from buying euphoria and selling panic
- Includes options and stablecoins, not just price
- History is free through the API
What it can't do
- Gives no entry point or stop
- Extreme zones can last for weeks
- CMC doesn't disclose component weights
- Mostly follows price rather than leading it
The index is a good market thermometer and a poor trading system: the decision still comes from the chart and your risk per trade.
If you trade futures, get comfortable with leverage and long and short positions first. In those trades the index is only background.