

RSI Indicator Explained: How to Read and Trade RSI in Crypto
RSI (Relative Strength Index) measures how strongly price has risen compared with how it has fallen over the last 14 candles. It moves from 0 to 100: above 70 the move is considered overheated to the upside, below 30 to the downside. But in a strong trend "overbought" can last for weeks, and shorting it is the fastest way to lose money with RSI.
Contents
- What the RSI indicator shows in plain words
- RSI formula: how it is calculated, without the heavy math
- RSI indicator settings on TradingView
- Overbought and oversold: why 70 is not a short signal
- RSI divergences: regular and hidden
- RSI strategy for crypto futures: a worked example
- Combining RSI with EMA, volume and Bollinger Bands
- Common RSI mistakes
- Where to trade with RSI
What the RSI indicator shows in plain words
RSI is a momentum oscillator. It does not tell you whether a coin is cheap or expensive. It tells you who pushed harder over the last N candles: buyers or sellers. RSI at 80 means the rally went almost without pullbacks. RSI at 20 means the drop went almost without bounces.
The full form is Relative Strength Index. J. Welles Wilder Jr. created it and published it in 1978, and today it is in every charting tool: TradingView, the charts on Binance and Bybit, and every mobile trading app. When people say "crypto RSI" or "RSI index crypto", they mean the same indicator applied to coin charts.
- 50 – the line between buyer and seller strength. In an uptrend RSI usually stays above 50, in a downtrend below it.
- 70 and above – overbought zone: the rise has been very sharp.
- 30 and below – oversold zone: the fall has been very sharp.
- Slope of the line – whether momentum is accelerating or fading, even if price is still moving the same way.
What matters most is not 70 or 30 but where RSI spends most of its time: above 50 the market belongs to buyers, below 50 to sellers.
RSI formula: how it is calculated, without the heavy math
The formula looks scary, but the logic is school-level. Take the last 14 candles and sort their moves into two buckets: all the closing gains go into one, all the closing losses into the other.
- Find the average gain over 14 candles: the sum of all gains divided by 14. Down candles count as zero.
- Find the average loss the same way, using only the down candles.
- Divide one by the other: RS = average gain / average loss.
- Convert to a 0–100 scale: RSI = 100 − 100 / (1 + RS).
RSI is simply the ratio of average gains to average losses, squeezed into a 0–100 range so you can compare it across any coin.
Example: over 14 candles the average gain is 1.5% and the average loss is 1%. RS = 1.5. RSI = 100 − 100 / 2.5 = 60. Buyers are stronger, but nothing is overheated. If the average gain were 3% with the same loss, RSI would come out at 75.
Wilder's twist is the smoothing. After the first calculation the averages are not recalculated from scratch but updated: new average = (previous average × 13 + current value) / 14. That is why one huge candle does not flip RSI instantly and old data fades out gradually. TradingView's help page uses this same formula, and its built-in RSI defaults to a length of 14 and the close price.
RSI indicator settings on TradingView
Adding RSI is simple: click Indicators above the chart and search for "Relative Strength Index". It opens in a separate pane below price. To change the settings, hover over its name in the pane and click the gear icon. It works the same way on the Bybit chart, since the exchange's trading terminal uses TradingView charts with the same Indicators button.
- RSI Length – the period, 14 by default. Shorter is faster and noisier, longer is smoother and slower.
- Source – which price to use, close by default. You almost never need to change it.
- Calculate Divergence – a toggle that marks bullish and bearish divergences in the pane for you. Divergence alerts only fire when it is switched on.
- Smoothing – a moving average on top of the RSI line: SMA, EMA, SMMA (RMA), WMA, VWMA or SMA + Bollinger Bands, with a default length of 14.
- Levels – in the Style tab you can move the 70 and 30 lines, for example to 80 and 20.
To start, you only need to touch the period and the levels, and it is worth switching on divergence detection right away – it saves time marking up charts.
70/30 or 80/20 levels for crypto
The 70 and 30 levels were designed for stocks, where moves are calmer. Bitcoin and especially altcoins move harder, so RSI hits 70+ and 30- much more often. In practice many crypto traders use 80/20 for altcoins and low timeframes: fewer signals, but cleaner ones. On BTC and ETH on the 4h and daily I keep the classic 70/30.
Best period for the RSI indicator
There is no single best period, only one that fits your timeframe. 14 is the standard, most guides and courses use it, so other traders are watching the same levels you are. A period of 7–9 speeds RSI up for scalping, while 21 smooths it for position trading. Try the period slider in the widget below and you will see the difference immediately.
| Style | Timeframe | Period | Levels | How to use it |
|---|---|---|---|---|
| Scalping | 1–5 minutes | 7–9 | 80/20 | Only in the direction of the higher timeframe, quick exits |
| Day trading | 15 minutes – 1 hour | 14 | 70/30, or 80/20 on altcoins | Enter on pullbacks when RSI turns up from 40–50 in a trend |
| Swing trading | 4 hours – 1 day | 14 | 70/30 | Divergences and exits from overbought or oversold zones |
| Position trading | 1 day – 1 week | 14–21 | 70/30 | Gauging market overheating, not timing entries |
These are starting values from practice. Test the setting on your coin's history before trading it.
Overbought and oversold: why 70 is not a short signal
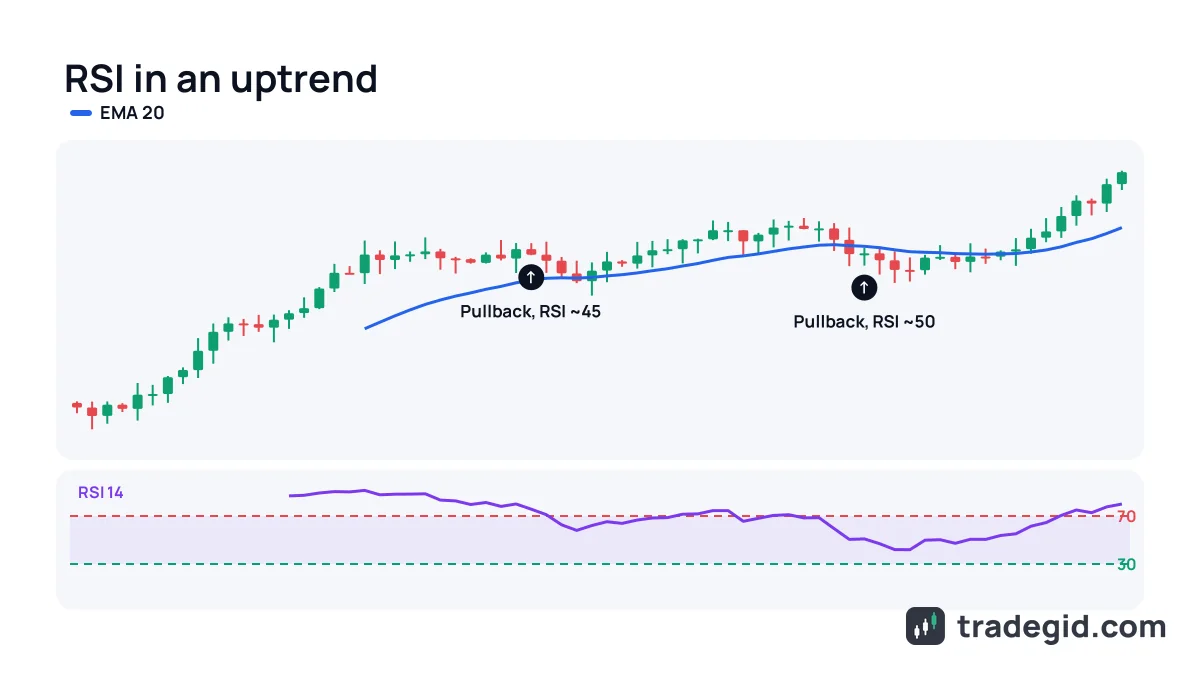
The classic beginner trap: RSI is above 70, so it is "overbought", so open a short. In a range this sometimes works. In a strong trend it does not. When Bitcoin rallies for weeks, RSI on the 4h can stay in the 70–85 zone for the entire move, and every short from 70 gets stopped out.
A high RSI is a sign of strength, not weakness. Buyers are pushing so hard that pullbacks barely get a chance to happen. The signal comes when RSI drops back out of the zone, falling below 70 after spending time above it. Even then it is a reason to take partial profit on a long, not an automatic short.
When 70/30 works
- A range with clear boundaries
- RSI exiting the zone, not just touching it
- The signal lines up with a level on the chart
- The higher timeframe shows no strong trend
When it misleads you
- A strong trend with RSI at 70–85 for weeks
- News and listings when price is just running
- A low timeframe trading against the higher one
- Illiquid altcoins with erratic candles
In a range RSI catches reversals; in a trend it finds pullback entries. Mixing up these two modes is the main reason people lose money on RSI.
RSI divergences: regular and hidden
A divergence is a disagreement between price and RSI. Price draws one picture, momentum underneath draws another. It is the most valuable RSI signal and also the most overrated: a divergence can form several times in a row while the trend keeps going.
| Type | Price | RSI | What it means |
|---|---|---|---|
| Regular bullish | Lower low | Higher low | Selling is fading, a reversal up is possible |
| Regular bearish | Higher high | Lower high | Buying is fading, a reversal down is possible |
| Hidden bullish | Higher low (pullback in an uptrend) | Lower low | The uptrend is likely to continue |
| Hidden bearish | Lower high (bounce in a downtrend) | Higher high | The downtrend is likely to continue |
Regular divergences are counter-trend, hidden ones are with the trend. In practice hidden divergences are more reliable because you trade in the direction of the main move.
How I filter divergences: only on 1h and above, with at least 5–10 candles between the two points, and only after confirmation – a candle close beyond a local level or a break of a trendline drawn on RSI. A divergence without confirmation is an observation, not an entry.
RSI strategy for crypto futures: a worked example
Here is a strategy that is good for learning: trading pullbacks in a trend. It does not try to catch reversals. It enters in the direction of the move once RSI cools down. The numbers are illustrative, this shows the logic, not a trade signal.
- Trend filterOn the 4h, price is above EMA 50 and RSI spends most of its time above 50. So we only look for longs.
- Wait for the pullbackOn the 1h, RSI drops into the 40–50 zone. In an uptrend RSI rarely reaches 30, so waiting for 30 means missing the entry.
- ConfirmationRSI turns up and closes a candle above 50, and price closes above EMA 20. Volume on the turn is at least average.
- Entry and stopEnter on the candle close. Stop goes below the pullback low or 1.5 ATR below entry, whichever is further.
- TargetFirst target is the previous high, second is 2R (twice the stop distance). At the first target, close half and move the stop to break-even.
RSI does not give the signal on its own here: it only shows the pullback is over. Direction comes from EMA and the higher timeframe, risk from the stop and position size.
Let us run the numbers. Account 2,000 USDT, risk per trade 1%, which is 20 USDT. BTC: entry 64,000, stop 63,000 – a distance of 1,000, or 1.56%. Position size = 20 / 1.56% ≈ 1,280 USDT. With 5x leverage the margin is 256 USDT. The 2R target is 66,000. If the stop is hit, you lose 20 USDT plus fees, not half your margin.
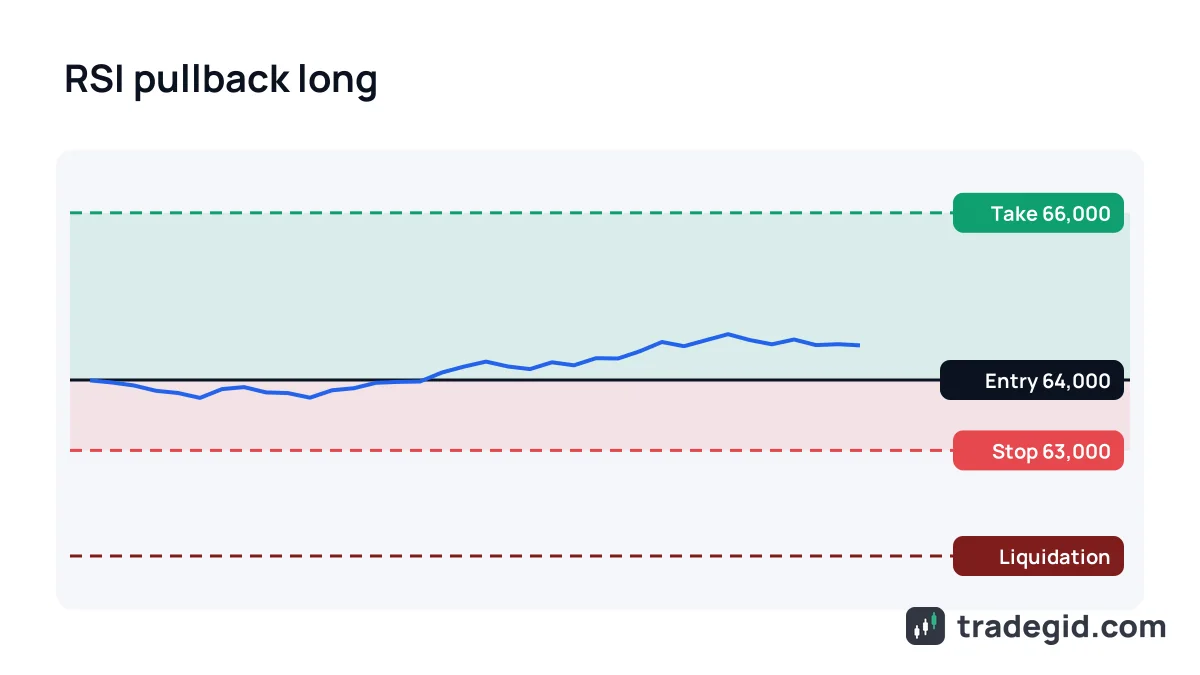
Size the position from the stop, not from the leverage. Leverage only decides how much margin is locked up. More on this in our guides to leverage and liquidation, and the position size calculator does the math for you.
Combining RSI with EMA, volume and Bollinger Bands
RSI is an oscillator, and on its own it does not understand trend well. That is why it is almost always paired with a trend indicator and volume confirmation.
- RSI + EMA – EMA 20/50 sets the direction, RSI picks the moment. Longs only when price is above EMA 50, shorts only below. More on averages in our moving averages guide.
- RSI + volume – an RSI turn on rising volume carries more weight than one in a thin overnight market.
- RSI + MACD – MACD confirms the momentum shift on the higher timeframe, RSI gives the entry on the lower one.
- RSI + Bollinger Bands – in a range, a touch of the lower band with RSI below 30 is a stronger bounce signal than either condition alone.
The best partner for RSI is a trend indicator. RSI answers "when", EMA or MACD answers "which way".
RSI vs CCI, Williams %R and ADX
| Indicator | What it measures | Range | Difference from RSI |
|---|---|---|---|
| RSI | Ratio of average gains to average losses | 0 to 100 | The baseline: smooth, widely used, good for divergences |
| CCI | Distance of price from its average | Unbounded, usually ±100 zones | No ceiling, so it shows extreme moves better but is noisier |
| Williams %R | Close relative to the high-low range | 0 to −100 | Faster and twitchier, closer to Stochastic than to RSI |
| ADX | Strength of the trend, not its direction | 0 to 100 | Tells you whether there is a trend at all – useful as a filter for RSI signals |
All four are built into TradingView. Using two of them together usually means duplication, except RSI with ADX.
Common RSI mistakes
- Shorting 70 in a trend. Overbought in a strong rally is a sign of strength. Wait for RSI to exit the zone and for the chart structure to break.
- Same settings on every timeframe. RSI 14 on the 1-minute and on the daily are completely different signals in weight.
- Entering on a divergence without confirmation. A divergence can form three or four times in a row while the trend continues.
- Ignoring the higher timeframe. Oversold on the 15-minute inside a 4h downtrend is usually just a pause before the next leg down.
- A stop "based on RSI". RSI has no price. Stops go on the chart – beyond a low, a level, or an ATR multiple.
- Fitting the period to the past. A period that worked perfectly last month will almost certainly disappoint next month.
Nearly every RSI mistake comes from using it as a complete system. RSI refines the entry inside a plan; it is not the plan.
Where to trade with RSI
Analysis is easier on TradingView: you can save indicator templates and set alerts, including on divergences. You can trade futures right on the exchange: Bybit's charts are built on TradingView, and RSI is added with the same Indicators button. Check that the exchange is available in your country before you sign up.
Futures with TradingView charts and indicators built into the terminal. You can sign up through the link.
Sign up on BybitJ8NKMGThe code can only be entered during sign-up.