

Liquidation price calculator for crypto futures: long and short
Enter your entry price, leverage and maintenance margin, and the calculator shows the price at which the exchange will force-close the position and how many percent away it is. The maths is for isolated margin and works for USDT-margined futures on Binance, Bybit, OKX, Bitget and Gate.
Contents
How to use the liquidation calculator
- Pick a sideLong if you expect the price to rise, short if you expect it to fall. A long gets liquidated below entry, a short above it.
- Enter the entry priceUse your average entry. If you built the position in several fills, take the average from the position panel on the exchange.
- Set the leverageUse the same leverage you set in the terminal for this contract. Leverage moves the liquidation price more than anything else.
- Enter the maintenance margin rateYou find it in the exchange's margin tier table. For BTC and ETH at a small size it is usually a fraction of a percent, more for small altcoins. If unsure, leave 0.5%.
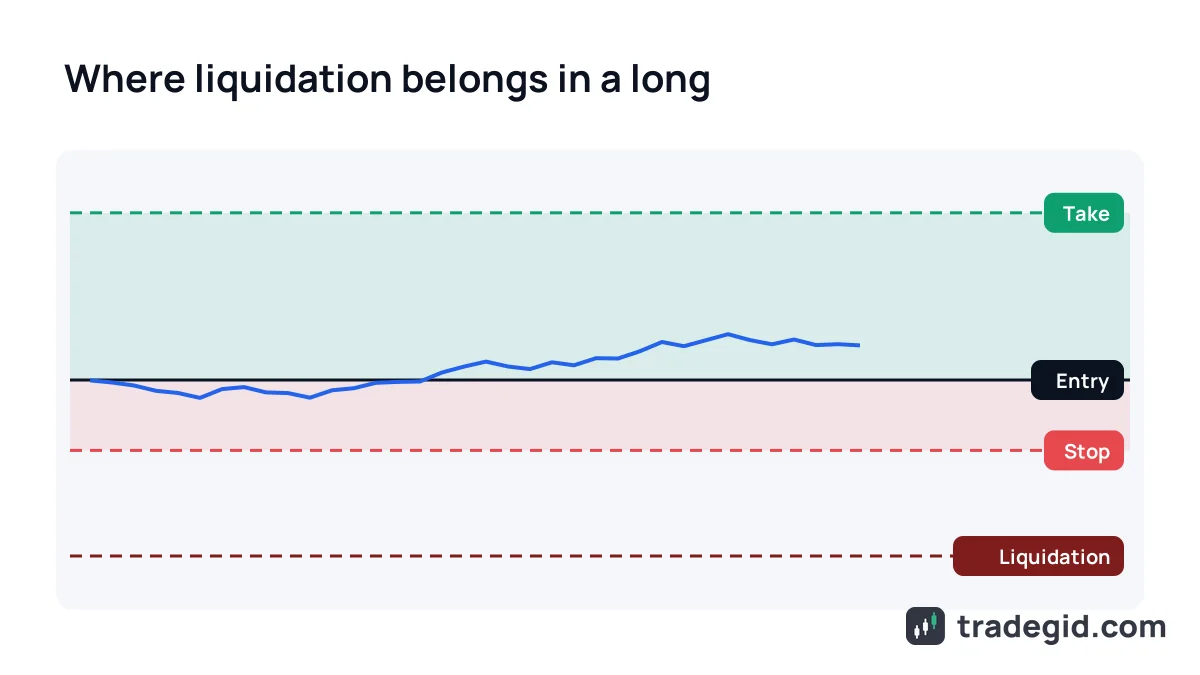
- Compare it with your stop-lossThe liquidation price must be clearly further away than your stop. If it is closer, cut the leverage or the position size.
The point is not a number accurate to the cent but one answer: will your stop trigger before liquidation or not.
I open it before entering, not when the trade is already red. Before entry you can still change leverage for free. After entry your only options are adding margin or cutting the position.
Liquidation price formula on isolated margin
In isolated mode only the position's own margin backs it. A position at L× leverage loses its whole margin when price moves 1/L against you: 10% at 10x. The exchange does not wait for zero, though. It closes the position earlier, when only the maintenance margin (MMR) is left. That gives the two formulas the calculator above uses.
Long liquidation formula
Liquidation price = Entry × (1 − 1/Leverage + MMR). A BTC long from 60,000 at 10x with 0.5% MMR: 60,000 × (1 − 0.1 + 0.005) = 54,300. A 9.5% drop is enough.
Short liquidation formula
Liquidation price = Entry × (1 + 1/Leverage − MMR). Same entry and leverage, but short: 60,000 × (1 + 0.1 − 0.005) = 65,700. A 9.5% rise is enough.
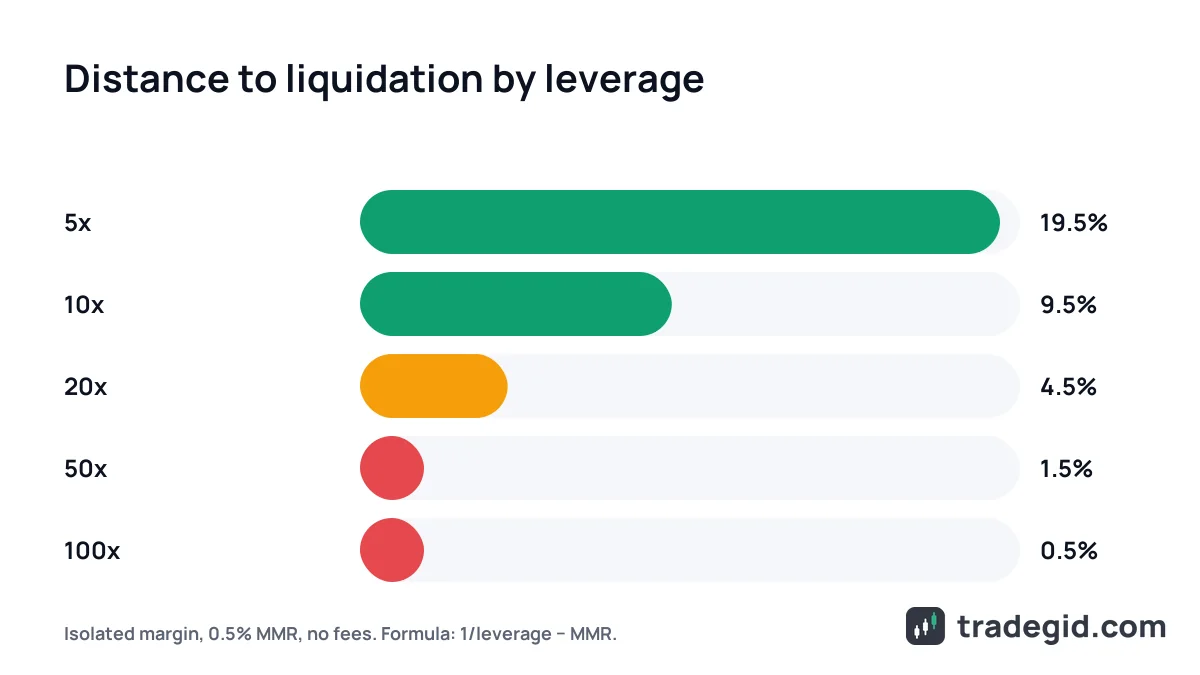
Distance to liquidation in percent is even simpler: 1/Leverage − MMR. In isolated mode neither your account size nor your position size changes it. Only leverage and maintenance margin do.
Liquidation price examples
BTC long at 10x
Margin 200 USDT, 10x, position 2,000 USDT, entry 60,000, MMR 0.5%. Liquidation is at 54,300. I would put the stop at 58,200, which is −3% from entry. If it triggers, the loss is 2,000 × 3% = 60 USDT, or 30% of the margin. Not pleasant, but there are still 3,900 dollars of price between the stop and liquidation.
ETH short at 20x
Entry 3,000, 20x, MMR 0.5%: 3,000 × (1 + 0.05 − 0.005) = 3,135. A 4.5% rise is enough. ETH does that in a day without much trouble, so the stop here has to sit well below 3,135, for example at 3,060.
Liquidation price on cross margin
In cross mode the whole free balance of the futures account backs the position, not just its margin. You can estimate liquidation with the same calculator: put the effective leverage = position size ÷ account balance in the leverage field.
Example: balance 1,000 USDT, position 5,000 USDT (500 margin at 10x). Effective leverage is 5x, so a long from 60,000 is liquidated around 48,300 rather than 54,300. It is a rough estimate: other open positions and their PnL also move the liquidation price. More on the two modes in cross vs isolated margin.
Table: leverage and distance to liquidation
| Leverage | Long liquidation | Short liquidation | Distance to liquidation |
|---|---|---|---|
| 2x | 30,300 | 89,700 | 49.5% |
| 3x | 40,300 | 79,700 | 32.8% |
| 5x | 48,300 | 71,700 | 19.5% |
| 10x | 54,300 | 65,700 | 9.5% |
| 20x | 57,300 | 62,700 | 4.5% |
| 25x | 57,900 | 62,100 | 3.5% |
| 50x | 59,100 | 60,900 | 1.5% |
| 100x | 59,700 | 60,300 | 0.5% |
Calculated with the formulas above, fees excluded. At high leverage the real MMR and fees eat a noticeable part of that distance.
Look at the bottom rows. At 50x a 1.5% move is enough, at 100x half a percent. BTC moves that much inside a single one-minute candle, and no analysis protects you from a random wick. That is why I only use more than 20x with a tiny margin and only intraday.
Why Binance or Bybit show a different liquidation price
If you compare the calculator with the position panel on Bybit or Binance, the numbers usually differ a little. That is normal, and here is where the gap comes from.
- Maintenance margin tiers. MMR grows with position size: the bigger the position, the higher the rate and the closer liquidation gets. Every exchange has its own tier table for every contract.
- Closing fee. Some exchanges reserve the fee they will charge on a forced close, so the real liquidation is slightly closer to entry.
- Mark price. Liquidation is triggered by the mark price, not the last traded price. In a sharp move they diverge, and a position can be closed even though the last-price chart never touched the level.
- Funding and added margin. Funding payments change the position margin, and adding margin manually pushes liquidation further away.
- Margin mode. In cross mode the whole account balance counts, so the isolated formula gives a price that is too close.
The calculator models one MMR level and no fees, which is fine for planning, but the number in your open position panel is the one that counts.
How to move your liquidation price further away
- Lower the leverage. Going from 20x to 10x widens the distance from 4.5% to 9.5%.
- Add margin to the isolated position. Effective leverage drops and liquidation moves away.
- Size the position so the loss at the stop is 1–2% of your account. The position size calculator does that for you.
- Set the stop-loss when you enter, not "once things become clear".
- Avoid holding high-leverage positions through big news and weekends, when liquidity is thinner.
The most reliable method is low leverage plus a stop that fires long before liquidation. Topping up margin on a losing trade is a rescue, not a plan.
Where to trade futures
All three exchanges below show the liquidation price in the position panel and publish maintenance margin tiers for every contract. Before your first trade, open that table and check the MMR for your coin. Availability depends on your country, so check the exchange's terms before you sign up.