

Moving Average Indicator: EMA vs SMA, Best Settings and Strategy
A moving average is the average closing price of the last N candles, recalculated as each new candle closes. It smooths out noise and shows the direction of the trend. The EMA reacts faster to recent candles, the SMA is smoother and weights every candle equally.
Contents
What is a moving average indicator
A moving average (MA) is the oldest and simplest trend indicator. Take the closing prices of, say, the last 20 candles, average them and plot a point. On the next candle the oldest price drops out, the newest comes in, and the line moves forward.
In practice it answers one question. If price is above a rising average, the market is trending up. If it is below a falling average, it is trending down. If the average is flat and price keeps crossing it back and forth, there is no trend at all.
SMA vs EMA vs WMA: formulas and differences
SMA full form: Simple Moving Average. Formula: SMA 20 = sum of the last 20 closes / 20. Every candle has the same weight, so the line is smooth but slow. A sharp move yesterday counts exactly as much in the SMA 20 as a candle from three weeks ago.
EMA full form: Exponential Moving Average. Formula: EMA = close × k + previous EMA × (1 − k), where k = 2 / (N + 1). The latest candle gets about 9.5% weight in the EMA 20, about 3.9% in the EMA 50 and about 1% in the EMA 200. That is why the EMA turns earlier and hugs price more closely.
WMA: Weighted Moving Average. Weights increase linearly from the oldest candle to the newest. Its speed sits between the SMA and the EMA. Crypto traders rarely use it on its own, but it is a building block of other indicators such as the Hull moving average.
| Parameter | SMA | EMA | WMA |
|---|---|---|---|
| Calculation | Plain average of N closes | Close × k + previous EMA × (1 − k) | Linearly increasing weights toward the latest candle |
| Reaction speed | Slowest | Fast | Between SMA and EMA |
| False signals in a range | Fewer | More | Medium |
| Common use | Long periods: 50, 100, 200 days and weeks | Short and medium periods: 9, 20, 50 | Inside other indicators |
Formulas per TradingView Help Center and StockCharts ChartSchool, checked October 2026.
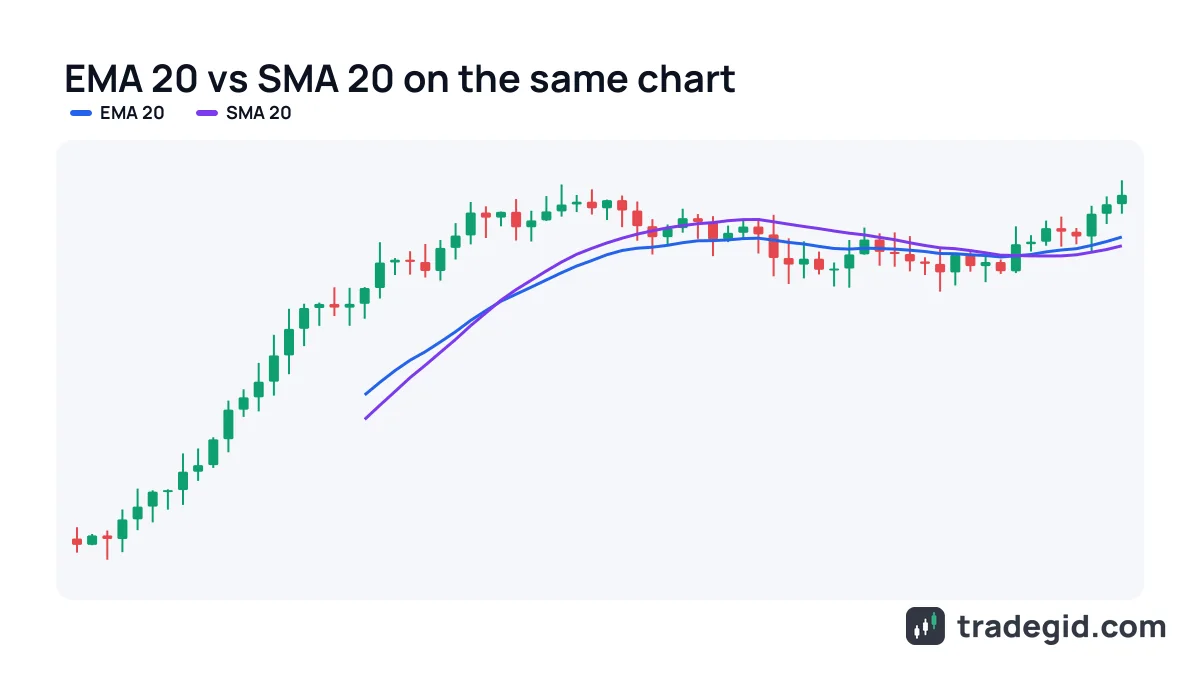
Best moving average settings: 9, 20, 50, 100, 200
The period is the number of candles in the calculation. The longer it is, the smoother the line and the more it lags. Below is how traders commonly use these periods in crypto. They are conventions rather than rules, and they matter partly because so many people watch them.
| Period | What traders use it for | Timeframe |
|---|---|---|
| EMA 9 | Fast momentum, trailing a stop in a strong move | 1–15 min, 1h |
| EMA 20 / SMA 20 | Short-term trend, pullbacks in a strong trend | 15 min – 4h, 1 day |
| EMA 50 / SMA 50 | Medium-term trend, the line between trend and correction | 1h, 4h, 1 day |
| SMA 100 | Deeper pullbacks, intermediate support | 4h, 1 day |
| SMA / EMA 200 | Main trend filter: above is bullish, below is bearish | 1h, 4h, 1 day |
| 200-week SMA | Reference for Bitcoin in deep bear phases | 1 week |
Crypto trades 24/7, so 200 daily candles are 200 calendar days, not 200 trading days as with stocks.
The 200-week average on Bitcoin gets a lot of attention. Historically price has rarely closed below it: in March 2020, in June 2022 (K33 Research put the average at about $22,400 then) and, according to media reports, in late June 2026. It is not a guaranteed bottom, just a zone where the market has historically been in a deep bear phase.
How to add EMA and SMA on TradingView
- Open the indicators listClick the indicators button in the top toolbar or press
/. - Search for the averageType EMA, SMA or Moving Average and pick the built-in one: Exponential Moving Average, Simple Moving Average or Weighted Moving Average.
- Set the lengthClick the gear icon next to its name. Default inputs are length 9, source close and offset 0. Enter the period you want, for example 50.
- Add more linesEach average counts as a separate indicator. To save slots, use Moving Average Ribbon: it draws up to four averages (SMA, EMA, SMMA, WMA or VWMA) as one indicator.
- Pick distinct colorsMake short averages bright and thin, long ones thick. After a few weeks you read the chart without checking labels.
The ribbon saves indicator slots: four averages count as one indicator instead of four.
The free Basic plan allows 2 indicators per chart, Essential 5 and Plus 10 (as of October 2026, see TradingView plans). If you want EMA 20, EMA 50 and SMA 200 on the free plan, the ribbon is the way to fit them in.
How to read moving averages
Slope and price position
- Average rising, price above it: uptrend, look for longs on pullbacks.
- Average falling, price below it: downtrend, longs against it are a gamble.
- Average flat, price crossing it every few candles: range, moving average signals are close to useless.
- Price far away from the average: the market is stretched, and chasing it gives poor risk to reward. Some traders measure this gap as a percentage, which is what moving average deviation indicators show.
Read the slope before the crosses. The slope tells you whether there is a trend in the first place.
Dynamic support and resistance
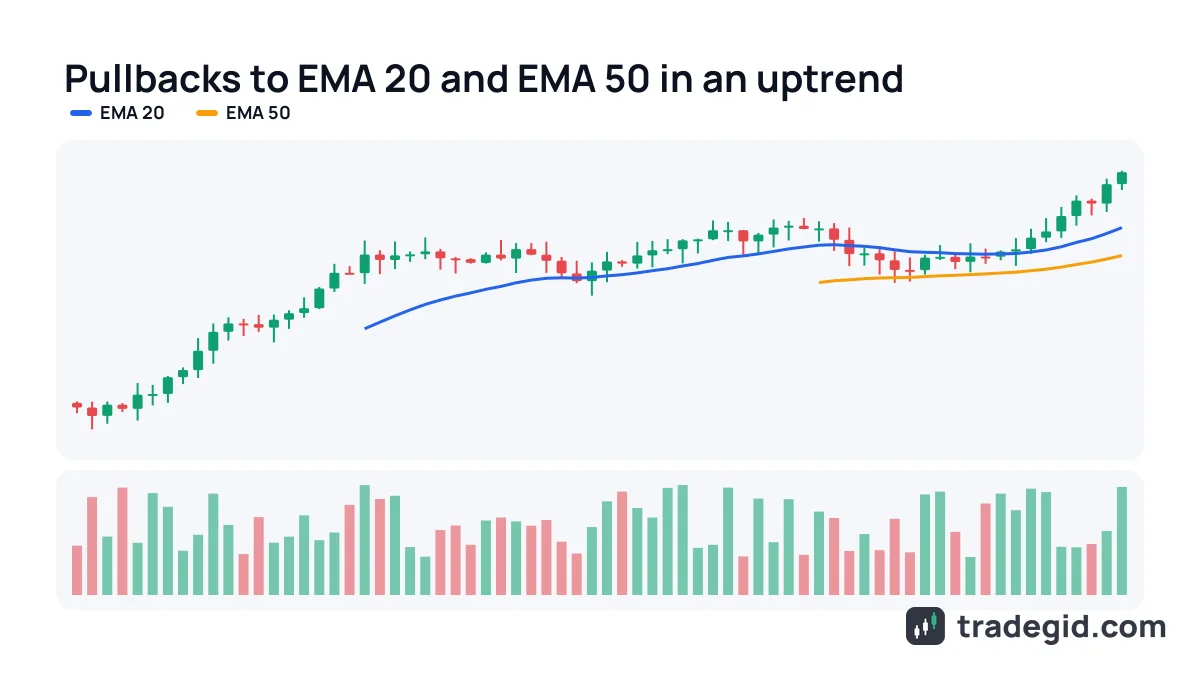
In a strong trend price often pulls back to the EMA 20 or EMA 50 and bounces. This is dynamic support: a level that moves with the market instead of staying horizontal. In a downtrend the same average acts as resistance from above.
An average is a zone, not a wall. Price can wick 1–2% through it and come back. That is why I put the stop under the nearest pullback low, which is often below the average, not right under the EMA line.
Moving average crossover: golden cross and death cross
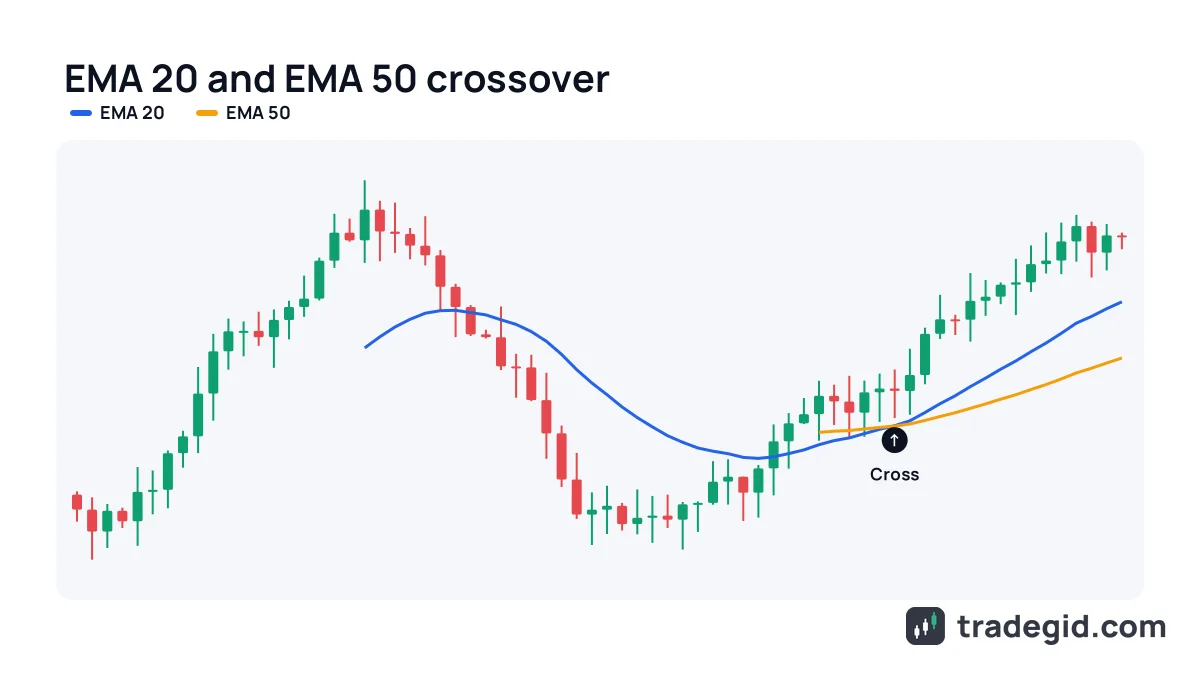
Golden cross: a short average crosses above a long one, classically the 50-day and 200-day SMA. Death cross: the same cross downward. These are slow signals. By the time the cross prints, price has usually covered a good part of the move.
The same idea works with shorter pairs such as EMA 9 and EMA 21 or EMA 20 and EMA 50. TradingView's built-in MA Cross indicator, for example, uses 9 and 21. The shorter the pair, the more signals you get and the more of them are false.
Moving average ribbon
A ribbon is 4–8 averages with nearby periods on one chart. When the lines fan out in order, the trend is strong. When they squeeze into a bundle and tangle, the market is ranging or getting ready to turn. Ribbons read well on 4-hour and daily charts. On minute charts they turn into spaghetti.
Moving average strategies for crypto
- EMA 200 filter. On the 1h or 4h chart, I only take longs above the EMA 200 and shorts below it. It is not a system by itself, but it removes a lot of bad trades.
- Pullback to EMA 20 in a trend. Trend confirmed (EMA 20 above EMA 50, both rising), price pulls back to the EMA 20, a bullish candle closes: enter, stop under the pullback low.
- EMA 9 and EMA 21 crossover on a lower timeframe in the direction of the higher-timeframe trend. Works for intraday trading, but only when the market is actually moving.
- Exit on the average. I hold a long while candles close above the EMA 20. A close below it means exit or take partial profit.
Moving averages work best as a direction filter and an exit guide. Pure crossover trading in crypto rarely covers its fees.
If you trade these setups on futures, remember that an average shows direction but does not protect you from a sudden move. Place the stop based on price and size the position from your risk per trade. More in the guides on leverage and long and short.
OKX offers spot and perpetual futures trading with moving averages available right in the trading chart. You can sign up through our link, the referral code is added automatically.
Sign up on OKXK2FMEIJ3The code can only be entered during sign-up.
Moving average mistakes in sideways markets
- Trading every cross in a range. The averages go flat, price slices through them every few candles, and every trade ends at the stop.
- Too many lines. Five averages on a chart will find "support" under almost any candle. Two or three are enough.
- Fitting the period to past data. An EMA 37 that perfectly held the last trend will not hold the next one. Popular periods work partly because everyone watches them.
- Waiting for an exact touch. An average is a zone, not a price. A limit order exactly on the EMA often misses or fills right before a wick through.
- Ignoring the timeframe. EMA 200 on a 5-minute chart and EMA 200 on a daily chart are completely different. The first covers less than a day.
Key rule: when the average is flat, ignore crossover signals and trade horizontal levels or stay out.