

MACD Indicator Explained: Formula, Settings and How to Use It
MACD tells you whether price momentum is building or fading. It is the gap between two exponential moving averages, the 12 EMA and the 26 EMA, plus a signal line and a histogram. It does not predict price and it lags, but it filters noise well and keeps you from trading against momentum.
Contents
What is the MACD indicator
MACD full form: Moving Average Convergence Divergence. Gerald Appel developed it in the late 1970s. The idea is simple: when a fast moving average pulls away from a slow one, momentum is growing. When they converge again, momentum is fading.
On TradingView, MACD sits in its own pane below the chart. Unlike RSI, it has no 0–100 range and no fixed overbought or oversold levels. Its values are in price units: on Bitcoin MACD can read in the hundreds of dollars, on a coin priced at $0.50 it reads in thousandths.
MACD components: two lines and a histogram
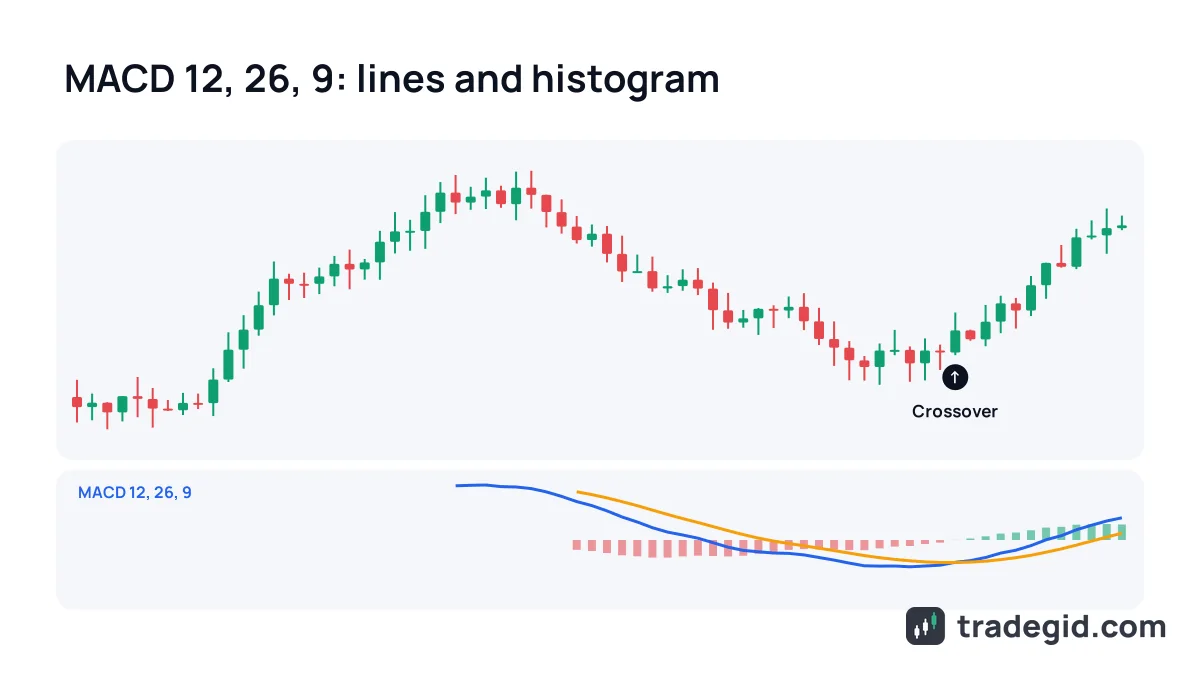
- MACD line = 12 EMA − 26 EMA of closing prices. Above zero, the fast average is above the slow one. Below zero, the opposite.
- Signal line = 9 EMA of the MACD line itself. It is a smoothed, slower copy of MACD.
- Histogram = MACD line − signal line. Bars grow when MACD pulls away from the signal line and shrink as the two converge.
- Zero line = the point where the 12 EMA and 26 EMA are equal. A cross through zero means the short average crossed the long one.
All parts come from the same two EMAs, so MACD confirms a move that has already started rather than calling it in advance.
MACD formula and calculation example
Say on the 4-hour ETH chart the 12 EMA is 2,410 and the 26 EMA is 2,380. The MACD value is 30. If the signal line is at 22, the histogram reads 8. The next candle closes higher, the 12 EMA reacts more, MACD rises to 34 and the histogram to 10. Upside momentum is accelerating.
Why is the short EMA faster? In an EMA the weight of the latest price is 2 / (N + 1). For the 12 EMA that is about 15%, for the 26 EMA about 7%. A new candle moves the 12 EMA roughly twice as much, and that gap is what MACD measures.
How to set up MACD on TradingView
- Add the indicatorClick the indicators button in the top toolbar or press
/, type MACD and pick the built-in indicator, not one of the many community scripts with a similar name. - Open the settingsHover over the MACD name in the top-left corner of its pane and click the gear icon.
- Check the inputsFast length 12, slow length 26, source close, signal smoothing 9. Oscillator and signal line MA type can be switched between EMA and SMA. For classic MACD, keep EMA.
- Use a higher timeframe if neededThere is a timeframe field: on a 15-minute chart you can display MACD calculated on 4-hour candles. The wait-for-close option keeps the value from repainting until that higher-timeframe bar closes.
- Set an alertAlt + A opens a new alert. Use a MACD and signal line cross or a histogram sign change, so you do not have to watch the screen.
Setup takes a minute. Save your indicators as a template and they load on any new chart in one click.
The free Basic plan on TradingView allows 2 indicators per chart, Essential 5 and Plus 10 (as of October 2026, see the plan comparison). MACD plus RSI fits inside the free limit.
Best MACD settings for intraday and swing trading
The default 12, 26, 9 counts candles, not days, so it works on any timeframe. On a 1-minute chart 26 candles is 26 minutes, on the 1-hour chart a little over a day. One crypto detail: the market trades 24/7, so 26 daily candles are 26 calendar days, while for stocks the same 26 trading days stretch to almost five weeks.
| Timeframe | Settings | What to keep in mind |
|---|---|---|
| 1 min, 5 min | 12, 26, 9; some speed it up to 8, 17, 9 | Lots of false crosses. Only take signals in the direction of the higher-timeframe MACD |
| 15 min | 12, 26, 9 | Common intraday choice, filter with the 1h or 4h MACD |
| 1 hour | 12, 26, 9 | Trades lasting a few hours to a couple of days |
| 4 hours, 1 day | 12, 26, 9; 24, 52, 18 for a smoother read | Few crosses, zero line and divergence matter more |
| 1 week | 12, 26, 9 | Overall market phase, too slow for entries |
There is no universally best setting. If you change the inputs, test them on the history of the same coin and timeframe.
How to read MACD: four signals
MACD and signal line crossover
MACD crossing above the signal line means short-term momentum turned up, crossing below means it turned down. It is the most frequent and noisiest signal. Below zero in a higher-timeframe uptrend it often marks the end of a pullback. In a downtrend it is often just a pause.
Zero line cross
MACD crossing zero is the 12 EMA crossing the 26 EMA. It is slower but cleaner: above zero the market is in an up phase, below zero in a down phase. I use zero as a filter. I look for longs when the higher-timeframe MACD is above zero and shorts when it is below.
MACD histogram
The histogram is the fastest part of the indicator. Growing bars mean momentum is accelerating. Shrinking bars mean the lines are converging and a cross is close. A shrinking histogram after a strong move is a reason to tighten a stop or take partial profit, not a reason to flip the position.
MACD divergence
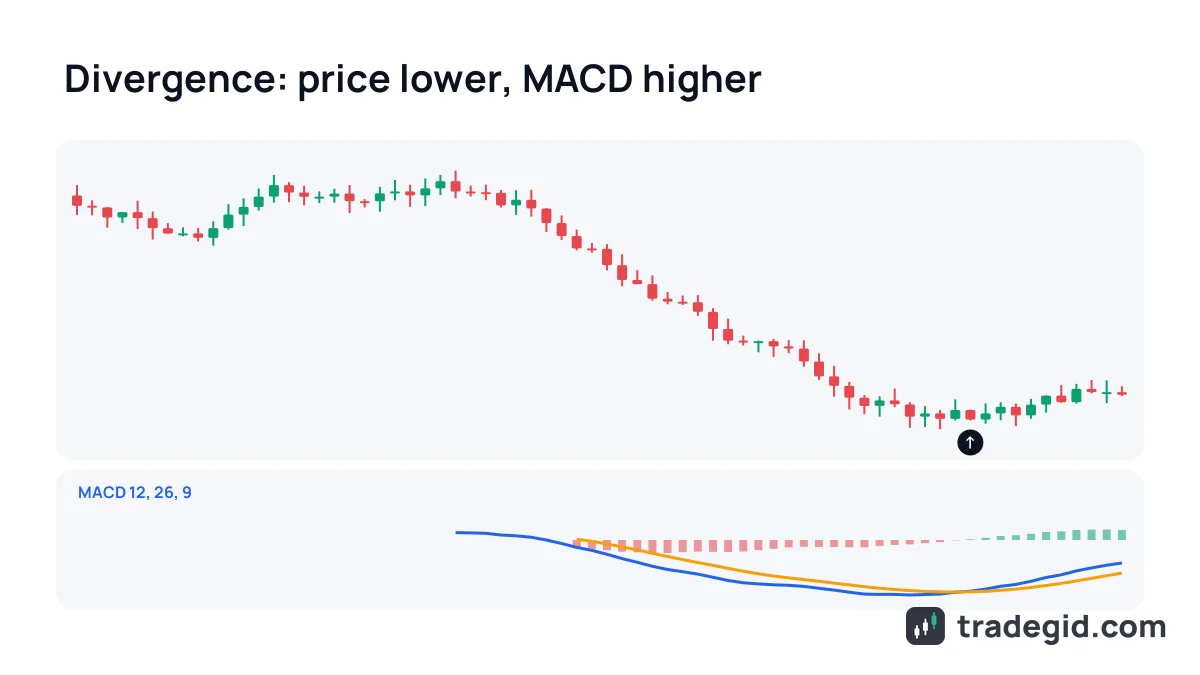
Bullish divergence: price makes a lower low while MACD or the histogram makes a higher low. Bearish divergence is the reverse at highs. It tells you the move is losing strength. In a strong trend you can get two or three divergences in a row before price actually turns, so I never enter on divergence alone without price confirmation.
| Signal | What it means | Where it helps most |
|---|---|---|
| MACD crosses above signal | Short-term momentum turned up | Below zero in a higher-timeframe uptrend: end of a pullback |
| MACD crosses below signal | Momentum turned down | Above zero in a higher-timeframe downtrend: end of a bounce |
| MACD above zero | 12 EMA above 26 EMA, up phase | Filter: longs only |
| MACD below zero | 12 EMA below 26 EMA, down phase | Filter: shorts only |
| Histogram shrinking | Move is slowing down | Tighten stop, take partial profit |
| Bullish divergence | Price lower, MACD higher | At support, with a confirming candle |
| Bearish divergence | Price higher, MACD lower | At resistance after a long rally |
No signal works on its own. Higher-timeframe trend and price levels first, then MACD.
Is MACD leading or lagging
Lagging. It is built entirely from moving averages, and moving averages are always calculated from past candles. The histogram reacts earlier than the lines, but it still trails price. That makes MACD better as a confirmation tool and filter than as a way to catch exact turns.
The main weakness follows from that: in a sideways market the lines keep crossing and each cross is a false signal. The second limit is the absolute scale. Comparing Bitcoin's MACD with an altcoin's makes no sense. If you need a percentage version, traders use PPO: the same formula divided by the slow EMA.
MACD trade example on crypto futures
Here is a setup I use often, with round illustrative numbers. Instrument: ETHUSDT perpetual futures, a long in the direction of the trend. This shows the logic, it is not a signal.
- Context on the 4-hour chartPrice above the 50 EMA, MACD above zero. Higher-timeframe trend is up, so I only look for longs.
- Pullback on the 1-hour chartPrice pulls back to old resistance around 2,380–2,400. The hourly MACD drops below its signal line and moves toward zero.
- TriggerThe hourly MACD crosses above the signal line on a closed candle, the histogram turns green and volume on that candle is above average. Entry at 2,400.
- Stop based on price, not on the indicatorStop below the pullback low at 2,340, which is 2.5% from entry. If price gets there, the idea is broken whatever MACD says.
- Position sizeAccount 1,000 USDT, risk 1% per trade = 10 USDT. 10 / 2.5% = 400 USDT position. With 5x leverage the margin is 80 USDT.
- ExitTarget 2,520, which is +5% or +20 USDT against 10 USDT of risk. If the 4-hour histogram starts shrinking earlier and the hourly MACD crosses down, I close half and move the stop to breakeven.
MACD only handles timing and trade management here. Direction comes from the higher timeframe, risk comes from the stop and position size.
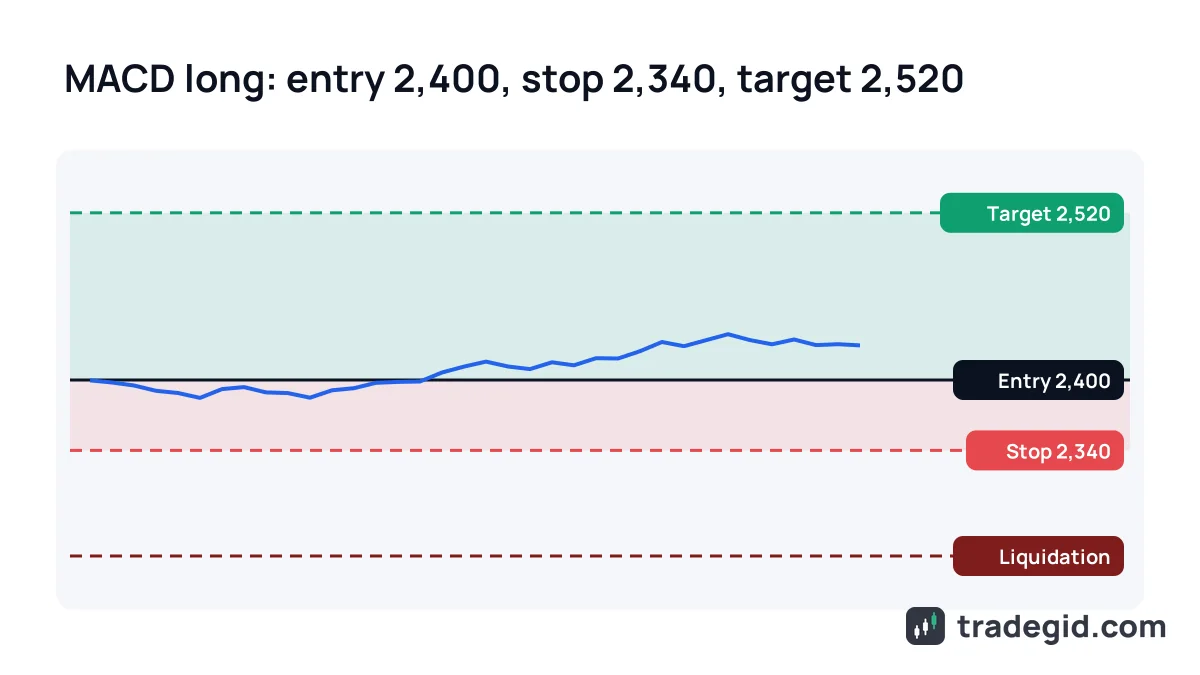
Note that leverage does not change the 10 USDT risk. The stop and position size set it, 5x only reduces margin. With isolated margin, liquidation on this long would sit roughly 19–20% below entry, far beyond the stop. See how it works in the guides on leverage and liquidation, and use the position size calculator to size trades.
Bybit lists USDT perpetual futures on ETH and many altcoins. You can sign up through our link, the referral code is added automatically.
Sign up on BybitJ8NKMGThe code can only be entered during sign-up.
Combining MACD with RSI and volume
- RSI shows overheating. A long on a MACD cross when RSI is already above 70 is often buying the end of a move. Better when MACD turns up and RSI is only just leaving the 30–50 zone.
- Volume. A cross on above-average volume is more reliable than one on a thin market at night or on weekends, when small orders move price.
- Moving averages on price. I only take MACD signals in the direction of the 50 and 200 EMA. Against them, I skip.
- Levels. MACD knows nothing about support and resistance. A signal at a level is worth more than the same signal in the middle of a range.
MACD answers one question: is there momentum. Levels, RSI and volume tell you where to enter and how stretched the market is.
Common MACD mistakes
- Entering on a cross before the candle closes. The lines can separate again and the signal disappears.
- Trading every cross in a range. Without a trend, MACD becomes a fee generator.
- Looking for overbought levels like on RSI. MACD has no fixed bounds, a high reading on one coin is normal on another.
- Curve-fitting settings to the last month. Inputs that nailed the previous move often fail on the next one.
- Using a cross back as a stop instead of a price stop. By the time MACD crosses back, price can be far past a sensible risk.
- Fighting a strong trend because of one divergence. Divergence warns, it does not reverse the market.
Almost every mistake comes down to using MACD as a standalone system instead of a filter on top of trend and levels.